Figure
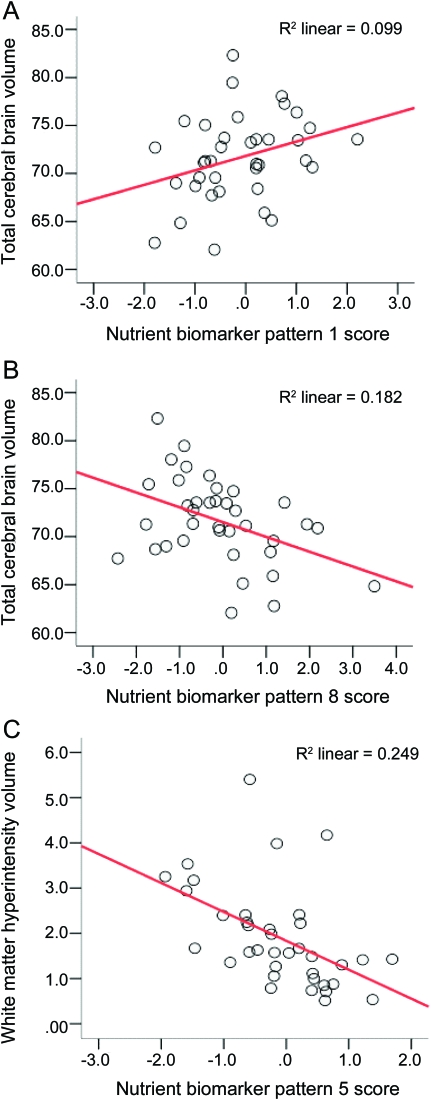
Nutrient biomarker patterns and volumetric MRI (n = 42)
Total cerebral brain volume (A, B) expressed as a % of total intracranial volume; white matter hyperintensity volume (C) includes periventricular and subcortical deep signals expressed as a % of total cerebral brain volume; x-axis represents the standardized score for NBP1-BCDE, NBP8–trans fat, and NBP5-marine ω-3 patterns.
