| PMC full text: | Published online 2016 May 17. doi: 10.1371/journal.pmed.1002019
|
Fig 3
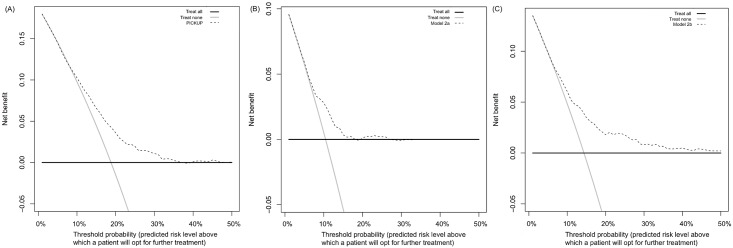
Net benefit of using PICKUP (A), Model 2a (B), or Model 2b (C) as a decision strategy. The net benefit (y-axis) is the net proportion of patients with poor outcomes who, based on the decision strategy, would correctly be recommended further intervention at the same rate that patients with good outcomes would not be recommended further intervention. The threshold probability (x-axis) indicates the range of predicted risk levels above which patients and their physicians might opt for further intervention. A threshold probability of 10% implies that a patient or physician would opt for further intervention if the predicted risk of chronic LBP was higher than 10%. The decision curve analysis estimates the net benefit of screening at all possible thresholds. On the plots, the line that is the highest over the widest range of thresholds indicates the strategy with the highest net benefit. For PICKUP (A), there is little difference in net benefit between the treat all strategy (grey line) and screening (dashed line) at cutoffs between 0% and 10%. At cutoffs between 12% and 35% predicted risk, screening with PICKUP would produce the highest net benefit. Treating none always yields a net benefit of 0 (black line). The highest net benefit usually occurs at the incidence of the outcome, in this case at a threshold probability of 19%.
