| PMC full text: | Published online 2015 Aug 19. doi: 10.1186/s12891-015-0632-0
|
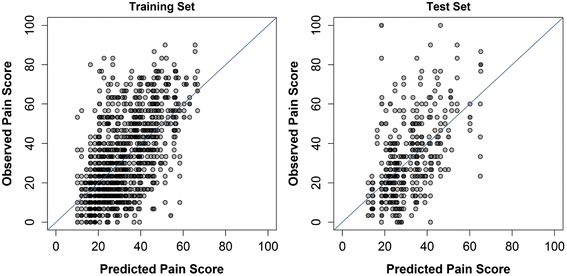
Fig. 4

Post-treatment model scatterplots. Observed pain scores are plotted against predicted pain scores from the final multivariate model for prediction of follow-up pain. The diagonal line perfect agreement between predicted and observed values is shown for reference