
The Leading Causes of Death This section is compiled by Frank M. Painter, D.C.
Send all comments or additions to: Frankp@chiro.org
If there are terms in these articles you don't understand, you can get a definition from the Merriam Webster Medical Dictionary. If you want information about a specific disease, you can access the Merck Manual. You can also search Pub Med for more abstracts on this, or any other health topic.


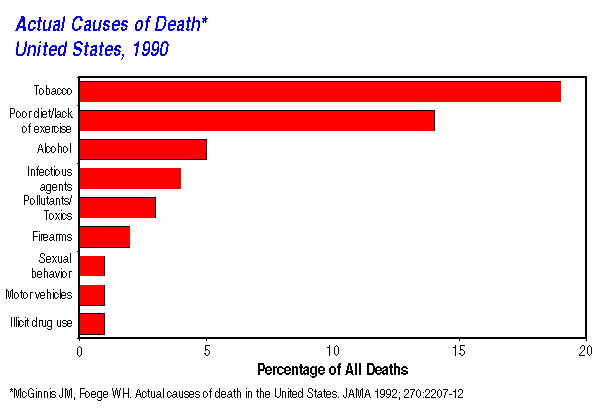
Careful analysis of the tables listed below will demonstrate that the leading killers are all lifestyle–related, and are preventable. Chronic diseases comprise the three leading causes of death in the United States –– heart disease, cancer, and cerebrovascular disease –– and they account for nearly two thirds of all deaths. Multiple behavioral risk factors such as smoking, poor diet, and lack of exercise often become habitual during youth or early adulthood, and contribute to the development of these chronic diseases over long periods of time.
Our diet is poor since it is composed of foods which are treated with pesticides, picked green, and then processed and treated with preservatives. Our grains are polished of their wheat germ coats, bleached, and then “(re) enhanced” with chemical “vitamins” which our bodies cannot absorb. To paraphrase Dr. Bruce Miller, “Supplementation is no longer an option!” In fact, based on the modern diet, it's the only way we can absorb sufficient nutrients to rebuild our cells, and to offset the stress on our systems from the Environmental Toxins and the other stressors we are exposed to in daily life. Take a look at the Food Guide Pyramid Page to see how much you'd need to eat just to stay healthy...and that is only if you were already healthy, and were not exposed to most of the mutagens we are surrounded by!
Other causes of death and disability from injury include: fires and burns; poisoning; drowning; violence, including homicide and suicide; motor vehicle crashes; and lack of use of bicycle helmet, seat belts, and child restraint seats. Injury has a disproportionate impact on children, youth, and young adults. Every day 60 children die from injury, almost 3 children every hour. Each year over 150,000 Americans die from injuries, and 1 in 3 persons suffers a nonfatal injury
Table 1: Age-adjusted death rates (per 100,000 population) for the 10 leading causes of death, from 1979 to 1991 in the United States
Cause of Death Number of Deaths
Rate per 100,000
25–44 years – All causes
148,904
177.8
Accidents @ and adverse effects
26,554
31.7
––Motor–vehicle accidents
14,528
17.3
––All other accidents and adverse effects
12,026
14.4
Human Immunodeficiency Virus Infection
22,795
27.2
Malignant neoplasms, including neoplasms of lymphatic and hematopoietic tissues
22,147
26.4
Diseases of heart
16,261
19.4
Suicide
12,536
15
Homicide and Legal Intervention
9,261
11.1
Chronic Liver Disease and Cirrhosis
4,230
5.1
Cerebrovascular diseases
3,418
4.1
Diabetes mellitus
2,520
3
Pneumonia and Influenza
1,972
2.4
–– All Other Causes (Residual)
27,210
32.5
Cause of Death Number of Deaths
Rate per 100,000
65 years and over – All causes
1,717,218
5,071.4
Diseases of heart
612,886
1,810.0
Malignant neoplasms, including neoplasms of lymphatic and hematopoietic tissues
386,092
1,140.2
Cerebrovascular diseases
140,938
416.2
Chronic obstructive pulmonary diseases and allied conditions
91,624
270.6
Pneumonia (98.5% of deaths)
and Influenza (1.5%)73,968
218.4
Diabetes mellitus
46,194
136.4
Accidents @ and adverse effects
30,564
90.3
––Motor–vehicle accidents
7,539
22.3
––All other accidents and adverse effects
23,025
68
Nephritis, Nephrotic Syndrome, and Nephrosis
20,955
61.9
Alzheimer's disease
20,848
61.6
Septicemia
17,340
814.5
From "Mortality Patterns -- United States, 1991" @
http://www.cdc.gov/mmwr/preview/mmwrhtml/00022217.htm
Review all deaths and death rates for the 10
leading causes of death by these age groupings
Thanks to the Disaster Center for this information!
Another way to think about how we make ourselves sick is by
looking at this chart of lifestyle-related causes of deathTable 2
The first thing that should stick out is how far down the list germs are...and right behind them are the Pollutants and Toxins It looks as though our environment, and our health goals have their work cut out for them!

Return to the STROKE Page
Return to ChiroZINE ARCHIVES
Return to the FOOD GUIDE Page
Return to the NUTRITION Section
Return to the CANCER AND NUTRITION Page
Since 1-01-1999
Updated 10-21-2010


| Home Page | Visit Our Sponsors | Become a Sponsor |
Please read our DISCLAIMER |
